Descriptive Analysis

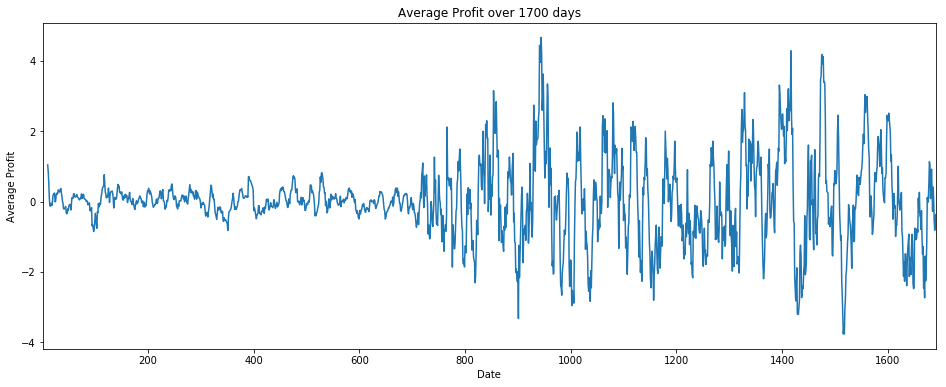
Investors depend on stock analysis to find potentially profitable stocks. The maximum profit per share booked in a single day: 20.51 Dollars The change rate through that Day: 25.74 % The minimum profit booked per share in a single day: -20.77 Dollars The change rate through that Day: -19.75 %

Average Profit

Though The Price of the Share Has Gone up.The Profits have highly been unstable for the later part of the stock sess. The exact same interpretation can be analyzed by manual analyzing the data The mean profit through all days is: 0.013 The standard Deviation viz a viz the mean is: 3.693 The Standard Deviation seems pretty high viz a viz the mean profit indicating high variablity in profit

PEG ratio

The price-to-earnings growth ratio takes the P/E ratio a step further by considering the growth of a company. To calculate the PEG, you divide the P/E ratio by the 12-month growth rate. You estimate the future growth rate by looking at the company’s historical growth rate. Investors typically consider a stock valuable if the PEG is lower than 1.
PEG ratio in the year 1 0.03
PEG ratio in the year 2 0.09
PEG ratio in the year 3 0.53
PEG ratio in the year 4 4.44
PEG ratio in the year 5 4.75

Below shows the stock price prediction of the next 30 days Plotting

Predictive Analysis-Observation

1.Analysing the simplicity of Feature set of the given dataset,the best bet would be using simple Machine Learning Algorithms.
2.We have restricted ourselves from using LSTM's or other DeepNeural Networks owing to manual feature selection and computation cost.
3.Due to strong correlation among all the features we mainly use the Adj.Close as a training feature viz a viz Dates.
4.The model aims at predicting the stock prices over next 30 days using LinearRegression(sklearn) or Random Forest

Prescriptive Analysis

1.The Descriptive Analysis reports a constant growth in prices of the IPO,suggesting a safe buy.
2.The First 15 days of the Predicted Prices show a steady growth,during which the investors book heavy profits. The above could be an effect of a successful product launch a merger or could be a steady decline in liablities.
3.During the next 15 days the stock prices observe a change in pattern and there is a decrease in IPO cost which could be owing to investors booking profit,a failed product,change in Government Policy or extensive competition.
4.The decrease in stock price presents an oppurtunity to invest in the organisation,by taking a calculated risk owning to the successful history of Tesla.

Diabetes classification

The vast majority of diabetic patients are classified into one of two broad categories: type 1 diabetes mellitus, which is caused by an absolute or near absolute deficiency of insulin, or type 2 diabetes mellitus, which is characterized by the presence of insulin resistance

Pregnancies, Insulin, Age, DiabetesPedigreeFunction are rightly skewed.

BloodPressure,SkinThickness,Insulin,BMI have outliers.It is clearly visible in the boxplots. ie some values lie outside the percentile ratio in this dataset.

The correlation plot shows the relation between the parameters.

Inference Drawn From The above data shows that Diabetes is a direct consequence of Obesity

plotting accuracy

Confusion Matrices

Team Members

"Alone we can do so little; together we can do so much."

Ananya Gupta

ML Developer

Shubhankar Tiwari

ML Developer

Nishkarsh Maitry

Web developer

Project Links